All datasets in this study used measured concentrations of toluene, methane, and polycyclic aromatic hydrocarbons (PAHs) as response variables. The dates on which the measurements were done were used as the continuous predictor variables. The three data points of the triplicates in Inoculated, Solvent Controls, and Sterile Controls were shown in Table 1. Methylcyclohexane, which is a kind of hydrocarbon recalcitrant to microbial degradation under methanogenic conditions, was used as the internal standrd for toluene measurements. The concentration of the internal standard is considered to be unchangeable throughout the experiment. The toluene to internal standard ratio were recorded as the raw data to show the concentration changes of toluene. The ratio was then transfered to percentage (see Table 2) by taking the Day 0 ratio as 100%. The methane and PAHs data did not require transformation, as external standards were used for measurements. The concentrations of methane and PAHs were recorded in the fashion of Table 1.
To visualize the raw dataset, a line chart was used to plot the toluene concentration in percentage, as is shown in Fig. 5. Due to some variations among different samples such as the concentrations on Day 55, it would be difficult to clearly show the degradation trend of toluene in a chronological order on a line plot without error bars. The variations in toluene concentrations is the result of the dynamic distribution of toluene between liquid (media and tailings) and gas phase (headspace) in each microcosm. Besides, the overlayed data points is another barrier for transparent visualization. Thus, a line chart with error bars would be suitable for illustrating the degradation rate of each compound in different microcosms. Comprehensive charts are shown in the page of results.
To visualize the raw dataset, a line chart was used to plot the toluene concentration in percentage, as is shown in Fig. 5. Due to some variations among different samples such as the concentrations on Day 55, it would be difficult to clearly show the degradation trend of toluene in a chronological order on a line plot without error bars. The variations in toluene concentrations is the result of the dynamic distribution of toluene between liquid (media and tailings) and gas phase (headspace) in each microcosm. Besides, the overlayed data points is another barrier for transparent visualization. Thus, a line chart with error bars would be suitable for illustrating the degradation rate of each compound in different microcosms. Comprehensive charts are shown in the page of results.

Table 1 Raw Data of Toluene Concentration in Different Treatments, with Dates of Measurements and Concentrations in Each of the Triplicates.
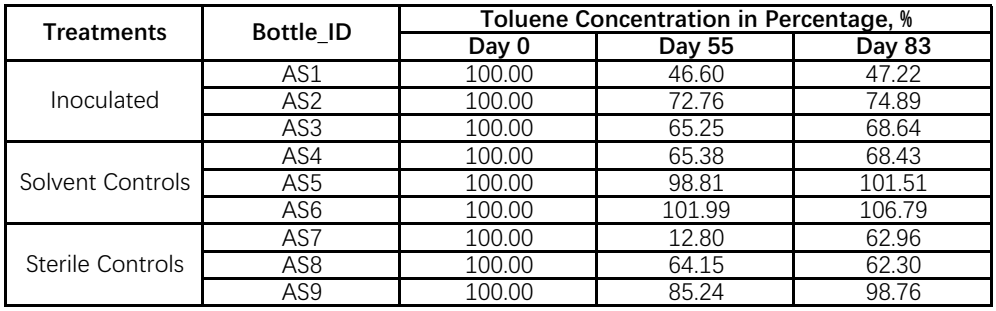
Table 2 Toluene Concentration in Percentage.

Fig. 5 Toluene Concentration in Percentage
Disclaimer: All the contents presented in this website were produced by Henian Guo as an assignment for RENR 580 at the University of Alberta and should NOT be interpreted outside of the scope of this assignment. Parts of the findings were not from the real experiment.
